Data that explains itself — with exact numbers
Drop in your figures. Get back a premium reel where the KPIs animate, the chart draws in, and a licensed bed plays — and every number is guaranteed correct. The B2B format pure-generative tools can't make, because they get the numbers wrong.
Premium look, trustworthy numbers
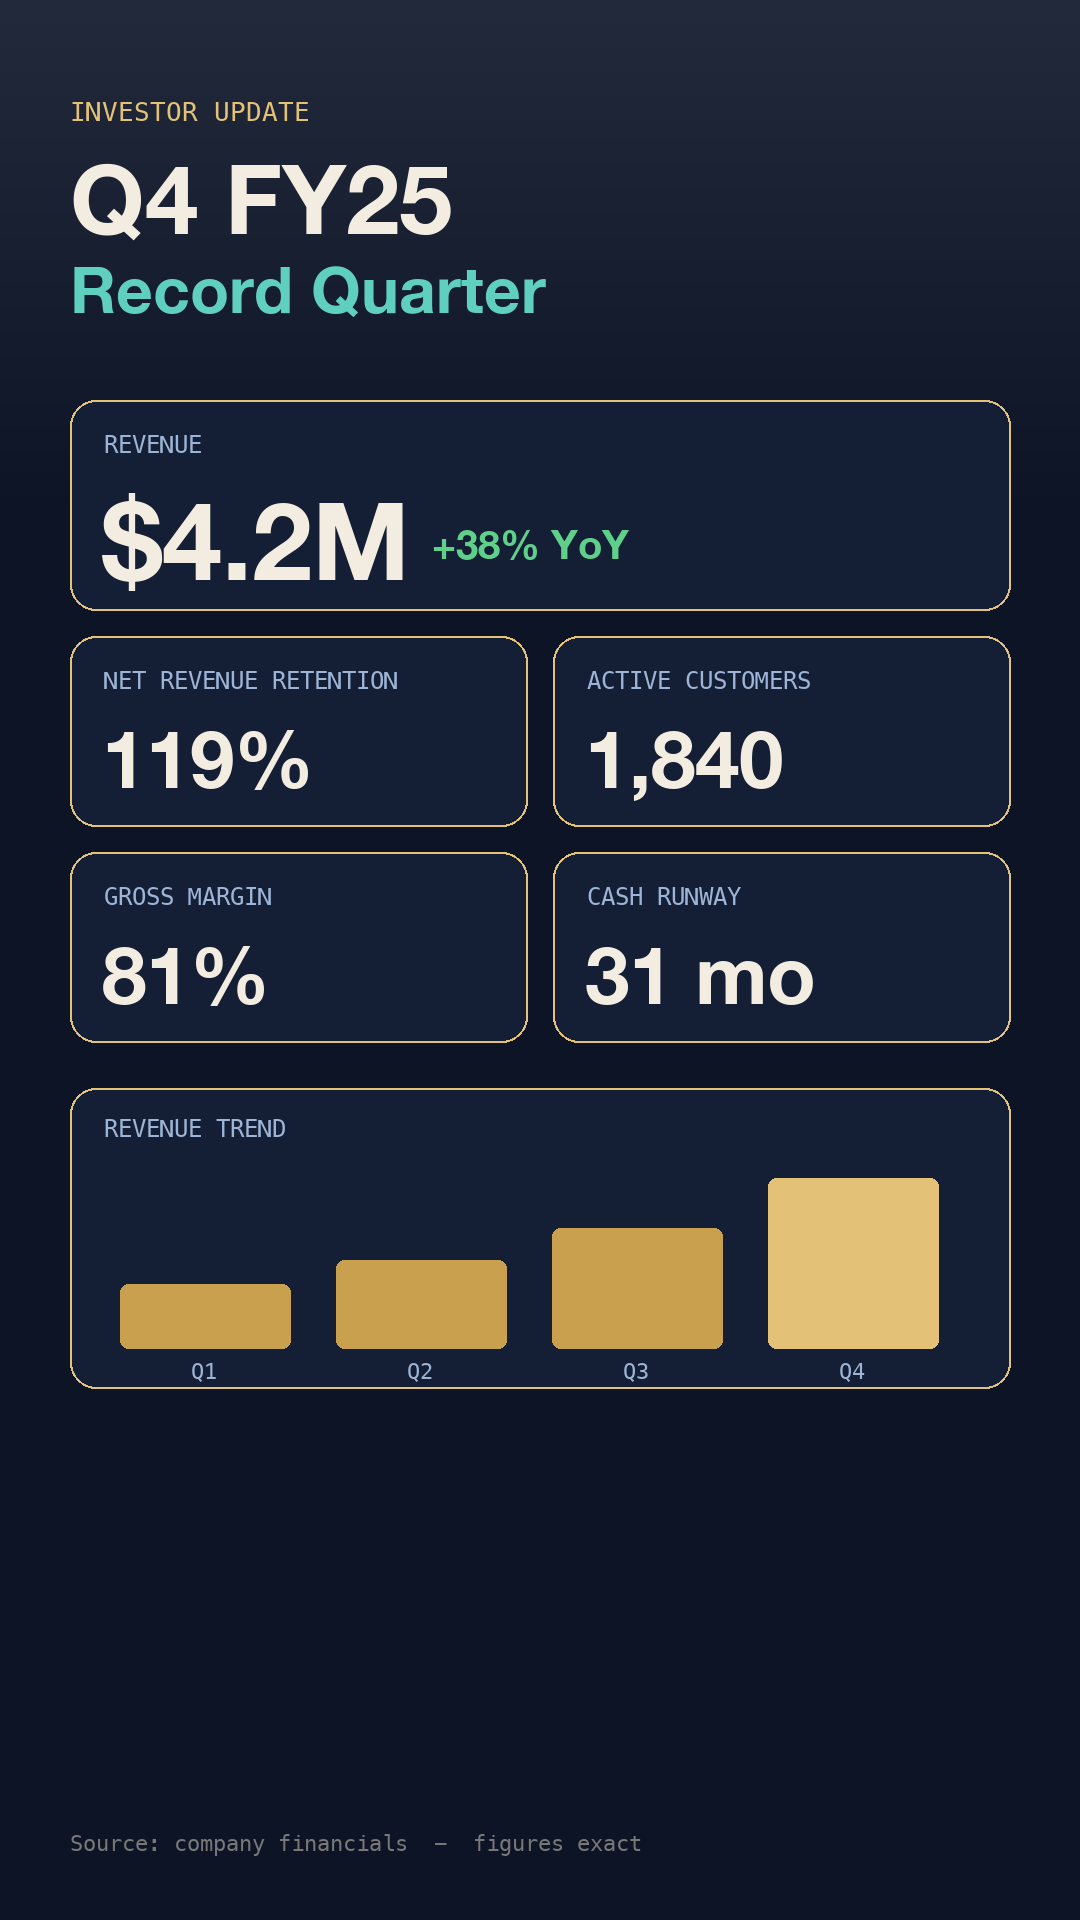
Headline, five labeled KPI blocks (Revenue $4.2M +38%, NRR 119%, 1,840 customers, 81% margin, 31-mo runway), a revenue-trend chart, and a confident licensed bed. Every figure is placed deterministically from the brief — not hallucinated.
Why design and numbers are split
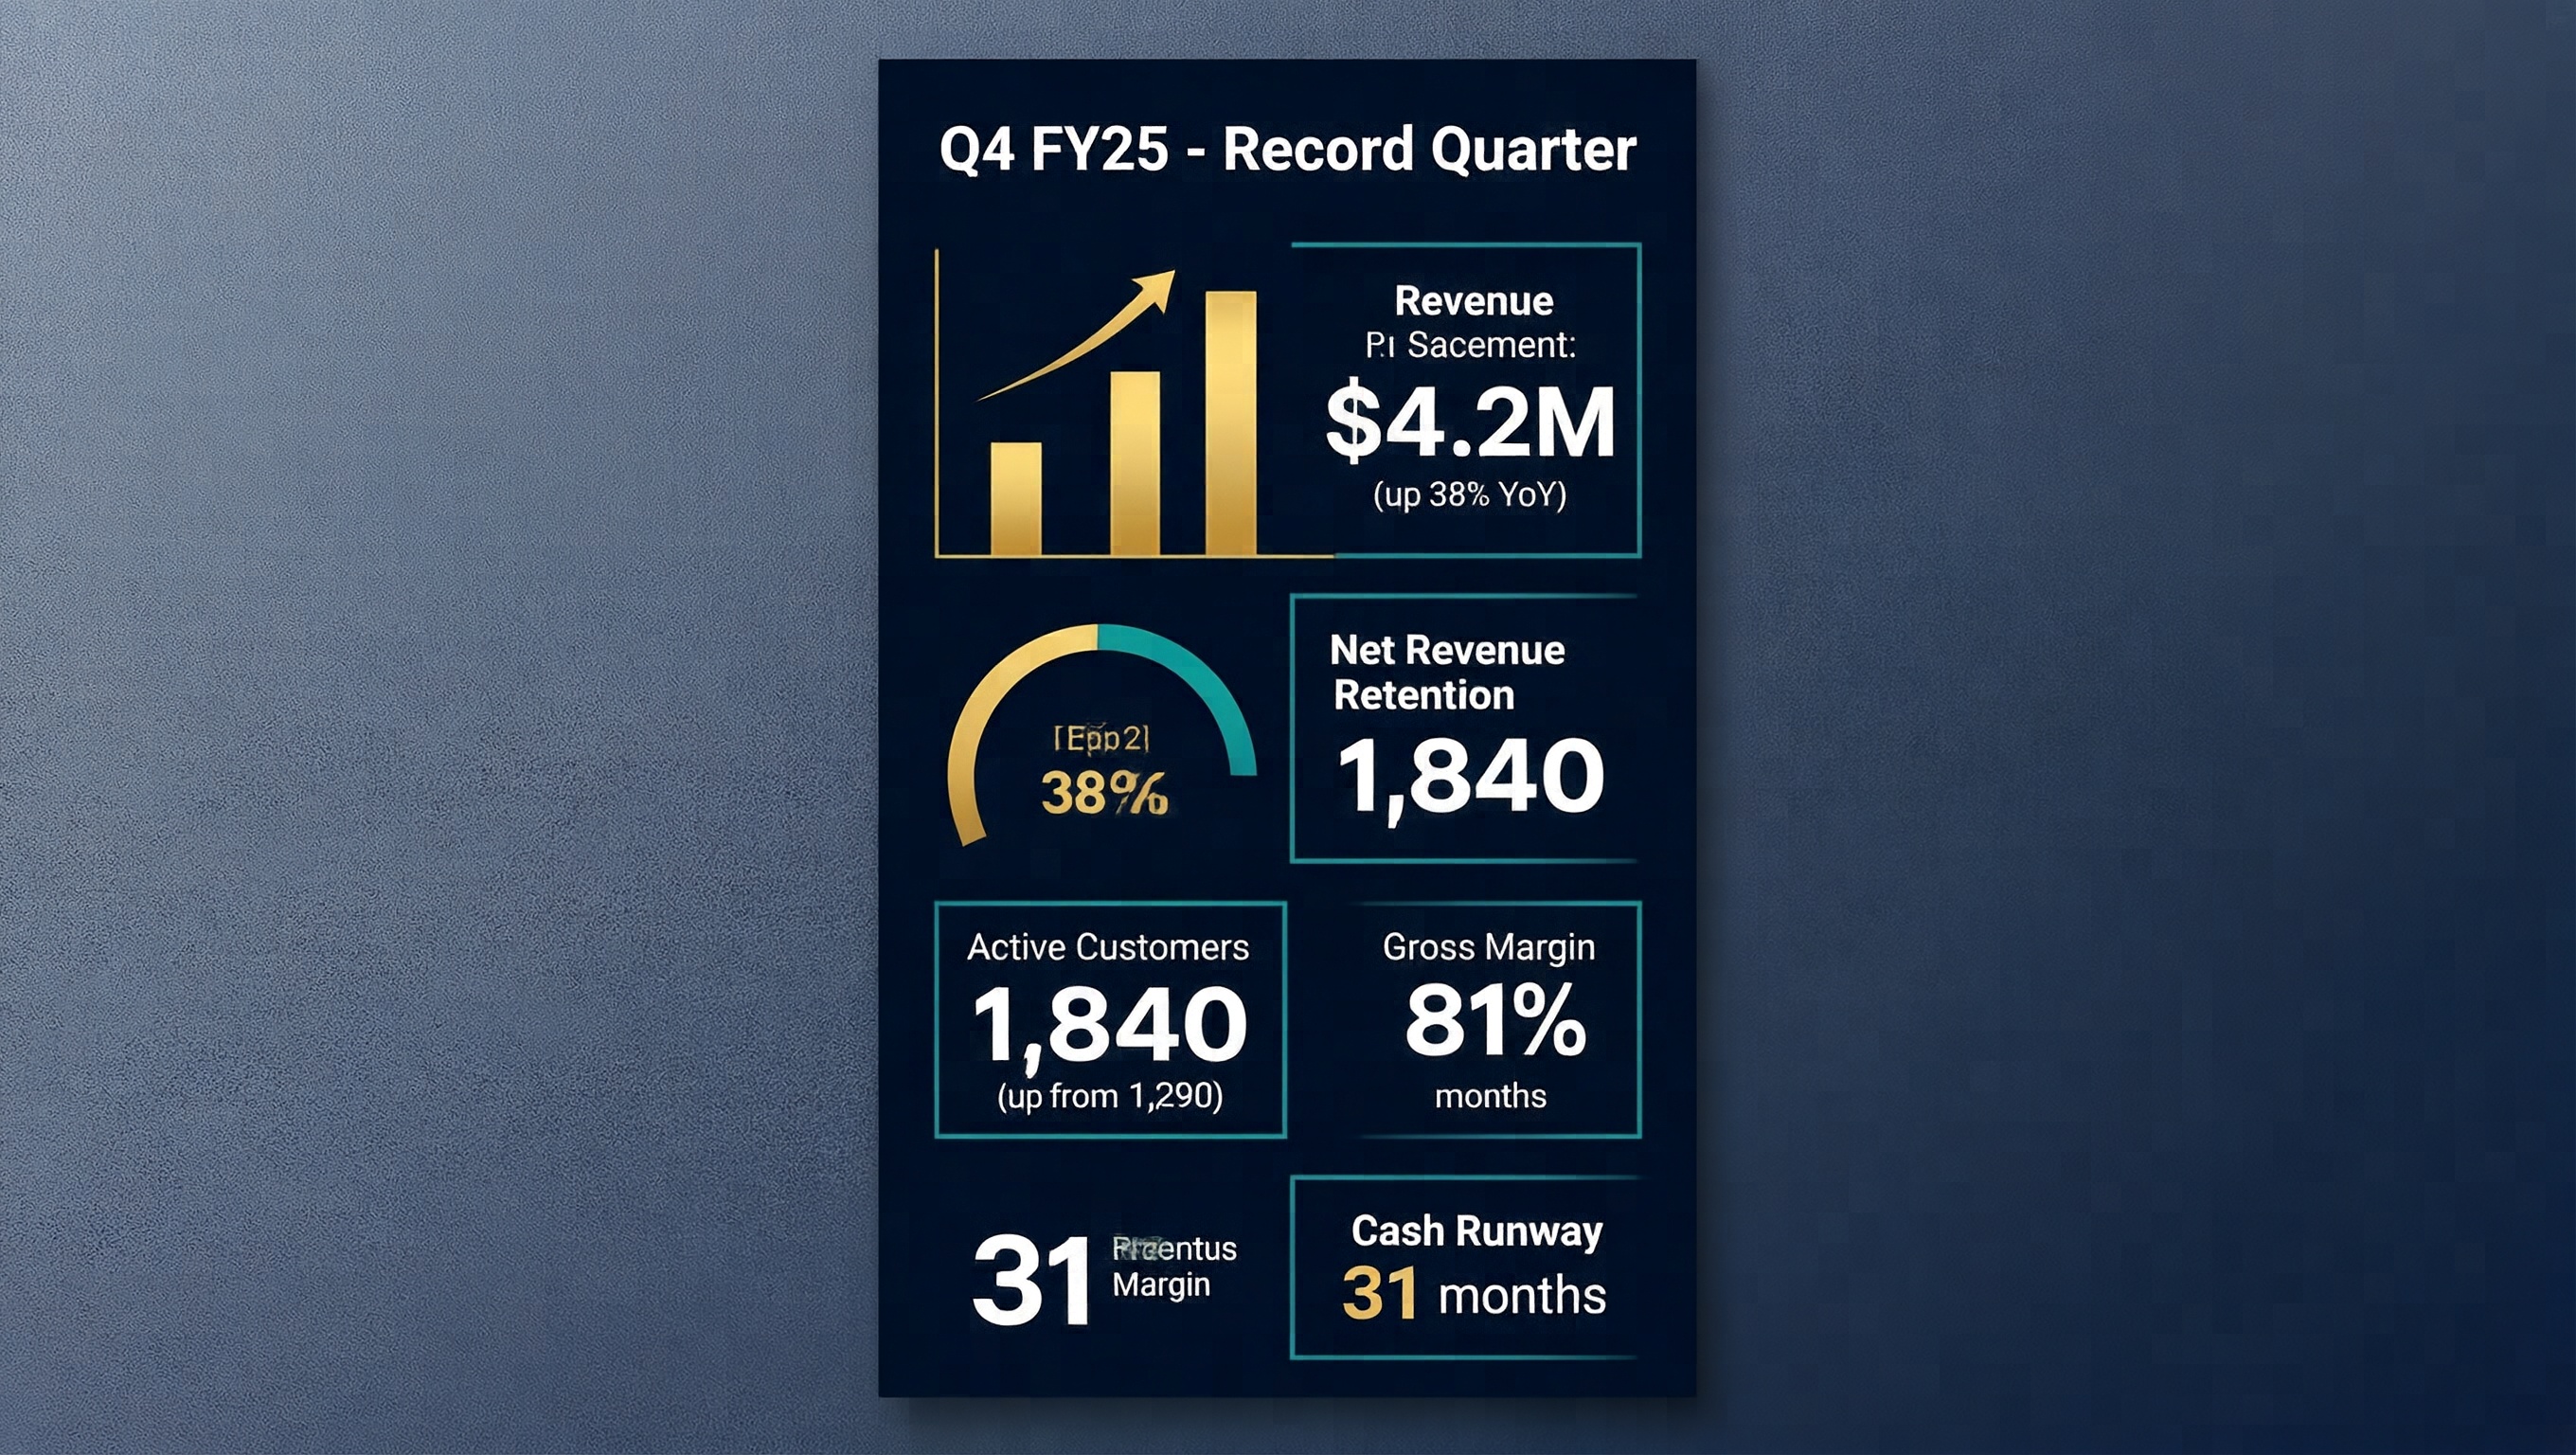
The marquee new cap, SenseNova U1, reasons about your data and proposes a beautiful layout. But like every AI infographic model, it gets the numbers wrong. So we use it for the design idea and a deterministic layer for the figures. Same data, both renders:
SenseNova U1 — design pass (don't trust the text)
- Premium layout, rising chart, clean blocks — genuinely good design sense.
- But: labeled NRR as "1,840" (the customer count), garbled labels ("Pl Sacement", "Egp2").
Deterministic layer — figures exact
- Every value + label placed from the brief, verbatim. NRR 119%, $4.2M, 1,840 — all correct.
- Animated count-ups + a chart that draws in (hyperframes; local PIL/ffmpeg fallback used here).
How it was made
SenseNova ran ~4 min (it's a heavy "thinking" cap — unblocked by the slow-cap timeout fix). Sonilo gave a 90s commercially-licensed bed. The numbers never touch an AI image model.